

 |
| Louisville Crime Lab |
 |
| Louisville Crime Lab Version 2 |
Next I tried to get as much government data as I could to map more information, but it wasn't easy. After open records requests, paid subscriptions, writing data scraping programs, and some heavy excel work, I was able to get sex offenders, restaurant health ratings, homes for sale, traffic speed and cams, and historic sites. I rewrote the map code and launched a new site with more data, re-branded as Metro Mapper, in March 2006.
After one month the site had visitors from six continents and lots of positive press. I felt like I was on to something, so I tried to expand the features, data and services. Soon there was a Derby map, Mapplets, partners, more crime, Courier-Journal coverage, and the San Jose NetSquared Contest.
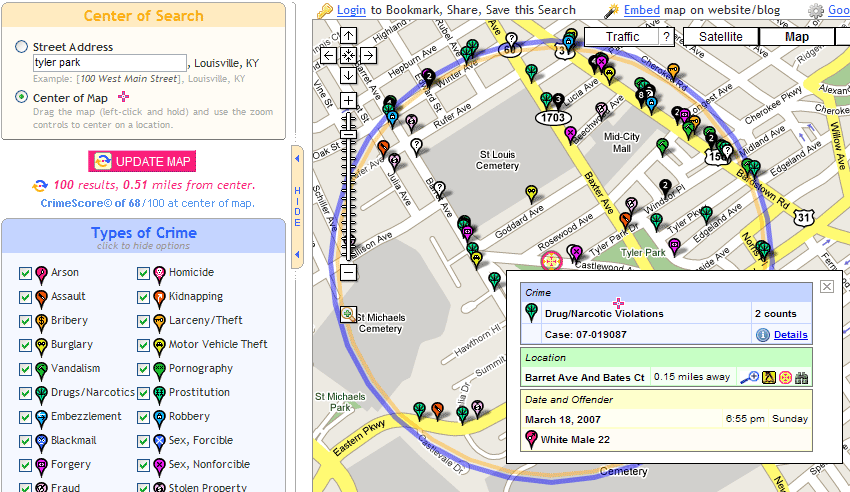
Here are some never-before-published screenshots of some internal testing where 100,000 crimes were visible on the map at once. Our heatmaps feature (and HTML5 version) now do something similar.


The next step in our evolution came with the launch of the national public mapping service, Your Mapper, in June 2009. It had let our focus go national and start absorbing more data. It also provided free map embedding and data access through an open API, and all the maps on Metro Mapper became powered by these unified public services.
Since then Your Mapper has also made some waves, including best of listing by Google Maps Mania, a speaker at the UofL Honors Lecture Series, Google's official maps certification, and write-ups by WFPL, Crunchbase, Useful Tools, DC Featured App, San Francisco App Showcase, Programmable Web, and Apps for Californians.

Now our goal is to get more city governments on board with our GovMapper public data mapping platform, and add tools to help local citizens view our data more effectively, like with Crime Kentucky and NYC Big Maps. GovMapper was just awarded a $30,000 grant by KSTC to help expand our data and government clients.
We've got a few new things to announce very soon, including a major city mapping client, a new business partner, and a data services widget/API client. So thanks for your support the last 6 years and let us know what you'd like to see us do next, and how we've helped you get to know your city better.


