Thursday, November 08, 2012

2nd Annual Louisville Transportation Camp Recap


Last night was the 2nd annual Louisville Transportation Camp, and the event was another huge success!  Over 40 people where there, including Ted Smith, Barry Barker, and representatives from different TARC and city departments, including Metro Technology, were there and provided insights and took feedback.


Also there were local entrepreneurs from Mavizon, Awesome Inc, Insider Louisville, Peak 10, Taco Punk, Forge, Building Layer, MapGrapher, and Roobiq.


After a tour of TARC's Gold LEED Certified building (the only government building to be certified as such in the nation, according to TARC), Ted Smith had some opening remarks, I gave a quick recap from last year's camp and talked about open data and the Your Mapper API, and Barry Barker discussed current initiatives and challenges at TARC, including getting a grant for all electric buses next year, RFID smart payment cards, route optimization, dedicated bus lanes, and budget constraints.

Current Status


Last year TARC opened its GTFS feed to Google and the public, allowing transit directions in all of Google's Map applications, and devs to build tools using the data.   While I'm not aware of Louisville developers that have used the data, there are lots of national services that have picked it up and ran with it, like HopStop, City Maps, and Transit App, and eventually Apple and Bing Maps.  Anyone in Louisville can leverage TARC transit directions within these apps.  City Go Round has another Louisville app list.

Real-Time Data


Finally we moved on to discussing the state of real-time GPS from the busses.  Currently, TARC is using third party software to allow them to manage their bus locations, called Trapeze.  Unfortunately, while this allows them to know the location of all 200+ busses via GPS at the TARC headquarters, the software does not allow export of this live data, for use in the real-time public feed.

TARC is pressuring Trapeze to upgrade their software to allow this.  By December, it is expected to be available on TARC's site on their Trip Planner (powered by Trapeze).  Green Bay Metro already uses this, if you want to see it in action now.

Then by March there should be another update that allows the data to be sent to the GTFS Realtime data feed, allowing real-time bus locations to be known by the public and Google.  This will make bus arrival times more accurate in apps and services, and allow animated maps to be creating showing all the city busses locations at once.

In the meantime, Mavizon offered to place their devices on any number of busses, I offered to make a web interface to visualize their locations on a map, and Peak 10 offered to host the servers, all for at no cost to TARC.  So we'll see if this pilot program idea moves forward at TARC.

Camera Feeds and Open Seats


Every TARC bus has multiple cameras installed, recording events locally.  But transmitting these images to the public is not feasible since they are encrypted by the vendor for security, and are high-res enough to cause bandwidth and cost issues even if they could be transmitted.  So the solution is to install an additional lower res camera and transmit that in isolation.  The goal would be to use software to detect the number of open seats and add this data to the real time apps.

But I believe the cost for this outweighs the benefit for now.  There are likely better solutions for counting passengers, using lasers, pressure plates in seats or exits, and other means.  But these will require some hardware installation and software to transmit the data back in real-time.  And I'm not sure that knowing how full a bus is will affect your decision to ride it very much.  Though it would be neat to see a map of every bus with color-coded markers showing capacity across the city, and a clickable live image of the passengers.

There also could be an app that could accomplish this through crowdsourcing.   A kind of Waze for busses.  Riders could report back on bus conditions, like capacity, noise, smells, mood, issues, etc.  I'm not sure how to get usage of this however, unless it's incorporated into a custom app that provides transit directions (like the ones listed earlier) and other features to keep users engaged.  But an idea worth pursuing for entrepreneurs.

Wi-Fi On-Board


Having Wi-fi access for passengers would be a great perk for bus riders, especially long-ride commuters, who could use the time to occupy themselves on laptops, tablets, iPod touches, and dedicated gaming devices.  One idea was to have some wireless hotspots that could be tested out on some busses to gauge demand.  Another was to partner with Boingo or GoGo to install paid wifi for customers, much like airlines do - that way TARC is not out of pocket and in fact can generate revenue shares from these services.

Summary


Like last year, there was a great energy and enthusiasm on the part of the public, local entrepreneurs, Metro Louisville, and TARC.  The ideas were a bit more focused this year, and seem to be within reach.  The next camp might be as early as March, when the real-time GPS feed is likely to launch.  Thanks to everyone who attended and let's keep the momentum going!

Other Coverage


Insider Louisville
Adam Fish - Forge


Saturday, January 28, 2012

Louisville Metro Partnership: Crime Incidents Map

The city of Louisville Metro has partnered with our government open data services and mapping company GovMapper to bring a daily crime incident reports map from the LMPD to the citizens of Louisville.


There are maps for every police division and beat in the city, with data updating daily.  The map customizations also allow the LMPD to include links to specific dynamic maps highlighting recent crimes for their community newsletter alerts.

Launched last week, this is the first time citizens can get daily crime updates from the LMPD with date range and category filtering.  

The service also includes mobile phone access, search exporting, and city-wide heatmaps of crime.  It allows full access to the raw data with latitude and longitude, fostering transparency and open data.  Programmers can also grab the data on-demand for their sites and apps through the Your Mapper API.

Your Mapper also curates a complimentary detailed historic crime reports map going back to 2003, which is updated every month.

Saving the City Money

I credit the office of Mayor Greg Fischer with helping to get this project started (via a tweet in June), and seeing the opportunity for cost savings from public online mapping.  From there Metro Technology Services took over to bring the map to fruition.  They turned to us, the only area Google Qualified Maps Developer.

One of MTS's goals is to save the city, and therefore taxpayers, money across all departments.  They know that by promoting government transparency and open data by putting data online in a way the general public could understand and use would have a huge ROI by reducing the thousands of FOIA requests the city has to fill.  If the public can discover, visualize, and export the data they need online 24/7, then wouldn't have to contact the city for time-consuming data requests.


Another goal of MTS is to create a catalog of raw open data for the public to download and use on their desktop, on websites, and in mobile apps.  To this end they have Louisville's Open Data Initiative, which aggregates data across agencies.  GovMapper has enhanced their raw crime data by adding latitude and longitude to each report, and then providing the entire dataset for download on the public open data site (see CrimeStats.txt).


Tuesday, December 13, 2011

Louisville Transportation Camp Recap

Last night was the first Louisville Transportation Camp, and the event was a huge success!  It was sold out and we were over capacity for sure (40+ people).  Mayor Fisher participated, and Ted Smith, Tom Owen, Barry Barker, and about 15 representatives from different TARC and city departments, including Metro Technology and PARC, were there and provided insights and took feedback.


It was a lively and spirited discussion about what information is currently available, what the public would like to see, and ideas for apps and websites that can use and combine the data in a useful way for citizens and visitors.  A number of datasets were pinpointed for future release by the city and TARC, including real-time GPS TARC bus locations, safe biking routes, pedestrian and bike injury/fatality locations, and locations of all parking garages and meters.


Other datasets were requested by people, but with no timeline or ability to release yet, including TRIMARC camera, sign and speed info, TARC bus real-time capacity and historic ridership info, real-time parking meter and garage occupancy, and real-time 311 calls.

Some developers showed off mobile and web apps they had been working on, including a total overview of the TARC system on a Google map, a mobile iPhone app that combined TARC stops and routes with data from the Your Mapper API (restaurants, car accidents, crime, etc), and an app for blind people to navigate the bus system easily.  


Other ideas were for a widget that restaurants can embed in their site showing their current health rating with interactive transit and biking directions to their location, a bike safety site, a mobile app that would alert riders when their bus was getting close, a site that would show you how far you could get on TARC in a certain time frame, and a parking space finder and bike lockup finder tool.

Looking forward, I'd like to hold a camp every time a new dataset is opened by the city.  Also, some people requested a Hack-a-thon which would be more tech focused and allow local programmers to create actually apps and sites over the course of a day using the available open data.  I'll help put this together as the interest level rises and more data becomes available.


Monday, November 21, 2011

Louisville TARC Opens Google Transit Feed and Transportation Camp

Louisville's TARC has published their transit feed to Google, allowing residents and visitors to Louisville to plan their trips on web or mobile Google Maps!


Mayor Greg Fischer, Innovation Director Ted Smith, TARC Director Barry Barker, and I were on hand at a city hall press conference last week to make the announcement.


Even better, TARC has made the wise decision to publish the link to their GTFS feed.  That means the general public can grab the raw data just like Google, and create their own apps, websites, and tools using the data.

TARC's Public Transit Feed Data : http://googletransit.ridetarc.org/feed/

Google grabs TARC's updated transit feed every Thursday.

Louisville Transportation Camp

To help facilitate the use of this data, I am hosting a free Louisville Transportation Camp.  This camp will introduce this data to local developers, and we will brainstorm app ideas, creating a prototype app by the end of the camp.  


We will also explore Louisville PARC's newly opened data, and all the data available on Metro Mapper (using the Your Mapper API).  A TARC technical representative will be on hand. And afterwards we'll ride TARC to a nearby watering hole.

Please sign up and spread the word.  It's a free event, but if you can donate if you'd like to be listed as a Supporter.  If your company wants to sponsor the event, they can do it on the event page or sponsor by providing swag, food, or supplies.  

Thanks!  Open transit data for Louisville's been a long time coming, and I'm glad it's here, so let's make the most of it.  Post in the comments your experiences using the data to get around.


Sunday, October 30, 2011

Reflections and History of Metro Mapper

Feeling nostalgic for the days when Google's Maps API was completely free (ie, last week), I'd like to share a quick history of Louisville Metro Mapper with all of the devoted fans I've had over the last 6 years as a kind of thank you.

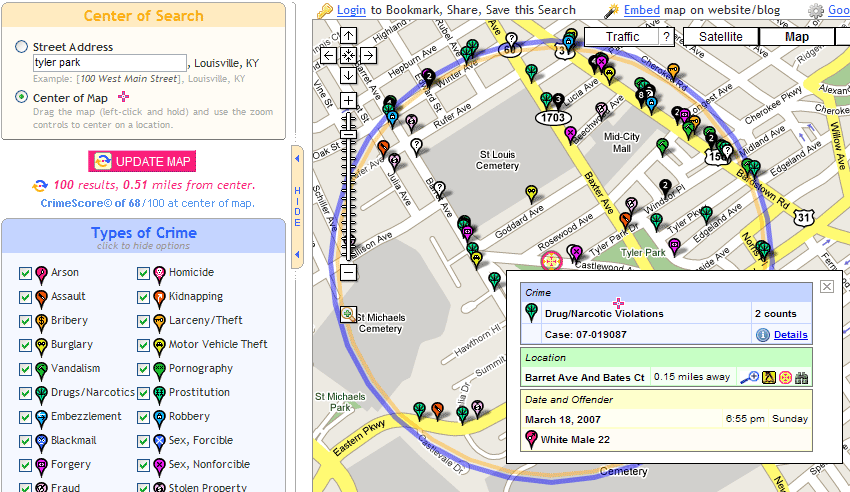
Metro Mapper came out of the desire to map detailed crime reports across the city of Louisville and Jefferson County. In 2005, there was no detailed breakdown of crime in the metro area, just zip code aggregates. I wanted to use Google new map API and some Web 2.0 AJAX tech to create one of the first Google Maps mashups. In July 2005 I launched the Louisville Crime Lab at louisvillelabs.com. The site's not up anymore but here is a screenshot.


Louisville Crime Lab
The Crime Lab also had a CrimeScore© feature that would give you a rating from 1-100 of how safe the area was, based on crime density.


Louisville Crime Lab Version 2

Next I tried to get as much government data as I could to map more information, but it wasn't easy. After open records requests, paid subscriptions, writing data scraping programs, and some heavy excel work, I was able to get sex offenders, restaurant health ratings, homes for sale, traffic speed and cams, and historic sites. I rewrote the map code and launched a new site with more data, re-branded as Metro Mapper, in March 2006.

After one month the site had visitors from six continents and lots of positive press. I felt like I was on to something, so I tried to expand the features, data and services. Soon there was a Derby map, Mapplets, partners, more crime, Courier-Journal coverage, and the San Jose NetSquared Contest.

Here are some never-before-published screenshots of some internal testing where 100,000 crimes were visible on the map at once. Our heatmaps feature (and HTML5 version) now do something similar.


The next step in our evolution came with the launch of the national public mapping service, Your Mapper, in June 2009. It had let our focus go national and start absorbing more data. It also provided free map embedding and data access through an open API, and all the maps on Metro Mapper became powered by these unified public services.

Since then Your Mapper has also made some waves, including best of listing by Google Maps Mania, a speaker at the UofL Honors Lecture Series, Google's official maps certification, and write-ups by WFPL, Crunchbase, Useful Tools, DC Featured App, San Francisco App Showcase, Programmable Web, and Apps for Californians.


Now our goal is to get more city governments on board with our GovMapper public data mapping platform, and add tools to help local citizens view our data more effectively, like with Crime Kentucky and NYC Big Maps. GovMapper was just awarded a $30,000 grant by KSTC to help expand our data and government clients.

We've got a few new things to announce very soon, including a major city mapping client, a new business partner, and a data services widget/API client. So thanks for your support the last 6 years and let us know what you'd like to see us do next, and how we've helped you get to know your city better.

Thursday, October 20, 2011

GovMapper is Awarded KSTC's Kentucky Enterprise Fund Grant

GovMapper has been selected by KSTC for the respected Kentucky Enterprise Fund grant this year!

Kentucky Science and Technology Corporation

GovMapper helps local governments get their data online for the public. This grant will help us reach more city and state governments across the nation, and show them how to open data for their citizens, promoting transparency and saving them tax-payer money at the same time. More about the grant from the KEF website:
The Kentucky Enterprise Fund (KEF) is a state-funded, venture capital-like fund that invests in Kentucky-based seed and early stage technology companies. Companies seeking funding from KEF go through a rigorous due diligence process and are judged in terms of industry fit, return on investment, and potential for economic development.
Special thanks goes to Louisville's local ICC office and the members of GLI's Enterprise Corp for their guidance and assistance, and of course the members of KSTC who we have worked closely with during the application and interview process over the last few months.

Wednesday, April 20, 2011

New Map: Franklin County KY Property Values

The Franklin County Kentucky PVA office is using Your Mapper's platform to map its property values county-wide.

Franklin County KY Property Values Map

Like the Jefferson County KY PVA before them, they see the value in opening up their public information to their citizens, and putting it into an easy-to-understand visual map. It saves their office time and duplication of effort, and Patsy Conway, the current PVA, it providing a great free service for the public good.

As with all of our government open-data clients, they are using the built-in features of the Your Mapper platform. Their data is published on Your Mapper in an interactive map, in a density heatmap by category, and in a mobile version viewable on any mobile phone browser. Our site helps to ensure the data reaches as many people as possible, and all of pages credit the PVA with the data and link back to their site for more information.

With Frankfort being the state's capitol and the county seat of Kentucky, the Franklin County PVA is leading the way for the rest of the state. Thanks to Patsy Conway, Jill Maynard, and the entire Franklin County PVA office.